�绰��010-84863903��
���棺010-84863953
���䣺maiqin@geoimage88.com
��ַ�������г�������Դ��·6��
���Ǵ���3502��
| Leapfrog 2025.3 |
Leapfrog 2025.3�汾˵�� Leapfrog 2025.3���ȿ���ͳ�ƺ�̽�������ݷ����������̣��ṹ���Ƶķ�����Ӧ�ã�����ǿƽ̨���ɡ� ����Leapfrog 2025.3 ������ʵ�ָ���Ч����ҵ���̣�����������ڱ�����Leapfrogƽ̨�����ⷵ�������ӵ�����ɿ������л�ȡ����������ʶ�� ���������������������ͳ��ͼ���ı��桢������ؿ����ܣ��Ż��ṹ���Ʒ���ģ�飬ʹ��ģ���̸�����ֱ�ۣ��������ܱ�ǩҳ���Ѽ���Imagoͼ�������似�����ر�ֵ�ù�ע���ǣ��꾮��ƹ��ܶ��û�����ʹ�õĹ��ܽ��������������������˹��ߵ�ʵ���Ժ������ԡ����⣬ͨ����ǿ��Evo��BlockSync�������ԣ�֧��δ���Ĺ������̣������������Ƶ�����ģ���û����棬Ϊ�û����������Ƶ����顣 ��Щ����Эͬ���ã���������������������һ���Ż��������飬��ΪLeapfrog�ij����Ľ��볤�ڷ�չ�춨������
Leapfrog 2025.3 Release Notes
Leapfrog 2025.3 prioritises statistical and exploratory data analysis workflows, simplifies the analysis and application of structural trends, and enhances platform integration. With Leapfrog 2025.3 you can work more optimally, stay in Leapfrog for a larger part of your workflow, eliminate rework, and gain greater understanding from geological and mining data. Key highlights include the ability to save, share, and revisit statistical graphs and tables; adjustments to structural trend analysis for clearer and more intuitive modelling; and Imago image streaming is now embedded within the correlation tab view. Worth noting are several frequently requested improvements added to the planned drilling feature, making the tool more practical and easier to use. Additionally, enhanced connectivity with Evo and BlockSync supports scalable, future-ready workflows, complemented by a redesigned conditional simulation user experience. Together, these updates provide immediate productivity gains, further advance the desktop experience and position Leapfrog for continued enhancement and longevity ��Ҫ�Ľ� Leapfrog 2025.3�а�������Ҫ���ܰ����� • ǿ���Imagoͼ���� • �������ͼ��֧���ڶ�ά����ά��ͼ�в鿴���ӻ���о��Ƭ • ��ѡ���ݼ�������������ͼ������ • ImagoӰ����Leapfrog��Ŀ��Խӵ��Զ���λת�� • ��Ч��ͳ�Ʒ��� • ����ͼ���ͱ����������������ظ����� • ��ǿģ����֤�������İ߿�ͼ • ͨ����ǿ�Ľṹ���ܻ�ø�����Ķ��� • ͨ������������˿���ʵ�ֽṹ���͵ĸĽ� • �ṹ���ƾ������������������� • �����ܡ������Ľṹ������������� • ��Seequent Evo��ȷ�ƿص�����Ϣ • Ϊ�����ѧ�������Σ�����������ļ��У�����Evo�������¼��� • �������������ݽ����������� • ���ɹ������ԣ��������л�ȡ�����ֵ • BlockSync�Ż�������ģ���¹������������������������� Main improvements
Top features included in Leapfrog 2025.3 include: • Powerful Imago image streaming • Drillhole correlation support for visualising core photos in both 2D and 3D views • Optional dataset parameter for flexible image setup • Automatic unit conversion for seamless alignment between Imago imagery and Leapfrog projects • Efficient geostatistical analysis • Save graphs and tables for easy organisation and less rework • Swath plots for enhanced model validation and evaluation • Deeper insights through enhanced structural capabilities • Improved structural interpretation with stereonet filtering controls • Greater transparency and flexibility in structural trend clustering • Smarter, more targeted structural trends with mesh filtering • Evolve your subsurface intelligence with Seequent Evo • Assign geoscientific objects a stage, organise them into folders, and bulk reload from Evo • Powerful new tools for interpreting Driver��s ellipsoid data • Get more from data by sharing attributes easily • Conditional simulation��s new streamlined workflow with BlockSync improves productivity and usability
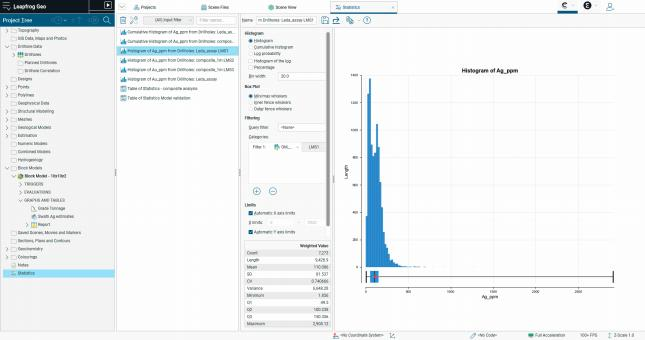
1. Leapfrog����������1.1. �������1.1.1. ��Чͳ�Ʒ���������ͳ�ƹ���1.1.1.1. �����ͼ��1. Leapfrog features and functionality 1.1. Drillhole data 1.1.1. Efficient statistical analysis with new statistics features 1.1.1.1. Saved graphs and tables
ͨ��Leapfrog 2025.3������ͳ�ƽ�����ڿɰ�ȫ���沢���ɷ��ʡ�������ͳ�Ʊ�ǩҳ���������ٱ��������ֱ�����ɱ����ͼ���������Ͳ���ÿ�ζ��������������ˡ� With Leapfrog 2025.3, your statistical findings are now securely saved and easily accessible. A new statistics tab allows you to quickly save and share report-ready graphs, eliminating the need to recreate them each session. �����ͼ������ʾ����Ŀ����ͳ��ģ���У��γɶ�̬�����⣬֧�ֵ��ʽ�ģ��������̿��ݡ�Э���;���֧�֡��û��ɽ������ɹ������������Ự�ͱ��棬�����ظ��ֶ�������רע�����ݽ�������ظ���ģ��ͼ��֧�ָ߶��Զ��壬�����ɵ����ֺź�ֱ�������������û���������רҵ�Ŀ��ӻ�ͼ������ʱ���ڱ������ʾ�� Saved graphs appear under a dedicated statistics item in the project tree, creating a dynamic library of analysis that supports auditability, collaboration, and confident decision-making across geological modelling and estimation workflows. Users can preserve their insights for future sessions and reports, reduce manual rework, and focus more on interpretation than recreation. Graphs are also more customisable, with adjustable font sizes and intuitive naming, helping users create clear, professional visuals ready for reporting and presentation.
1.1.1.2. ͳ�Ʊ��Ķ������ͳ�Ʊ�����һ��ܣ��û��������������ݣ����ڶԲ�ͬ����������ģ����֤�ĸ���ģ��������ģ�����ݣ����ж�̬�Աȡ��øĽ������˶��ⲿ������������ͬʱ�����������ݡ� �˴θ��±�־�������������Ч�Ϳɿ���ͳ�Ʒ���������������Ҫ��һ���� 1.1.1.2. Multiple inputs for table of statistics A new feature has been introduced to the table of statistics that enables users to add inputs, facilitating dynamic comparisons between different tables, such as composite and block model data for model validation. This enhancement minimises dependence on external software while improving transparency and traceability. This update marks an important first step toward a more connected, efficient, and reliable statistical analysis experience.
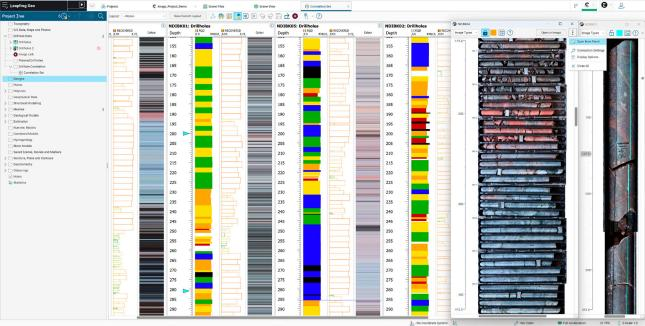
1.1.2. ǿ���Imagoͼ������Leapfrog 2025.2�汾�У������Ƴ���Leapfrog-Imagoͼ�����������������˵����ѧ���ڽ�ģ���δ�Ӱ���л�ȡ��ʶ�ķ�ʽ����Leapfrog 2025.3�汾�У����ǽ�һ���Ż��˸ü��ɹ��ܣ�����������������Ժ�����ԡ� 1.1.2. Powerful Imago image streaming In Leapfrog 2025.2, we introduced Leapfrog-Imago image streaming to revolutionise how geoscientists derive insights from imagery at every stage of modelling. In Leapfrog 2025.3, we have further enhanced this integration to improve its usability and flexibility. 1.1.2.1. ���������Leapfrog 2025.3�汾���ѽ�3D������ͼ�����������������ط�����֧����2D��3D�������������ɿ��ӻ�ͼ���⣬�����Ŀ��ٲ˵���ݷ�ʽ��ͬʱ���Imago��壬������������Ч�ʡ� 1.1.2.1. Visualise images in hole correlation Leapfrog 2025.3 now brings the same image streaming capability of the 3D scene to drillhole correlation, allowing images to be easily visualised in both 2D and 3D workflows. Additionally, a new quick menu shortcut makes it easier to open multiple Imago panels at once, improving efficiency when reviewing imagery.
1.1.2.2. ���ݼ��������������Imago���������е����ݼ��������ѱ�Ϊ��ѡ�ʹͼ�����ݵĽṹ���ø�������ԡ������ݼ�������Ϊ��ֵ���û������ֶ��л���ͬ�꾮���ͻ�������ݼ�����ΪLeapfrogϵͳ���������Ӱ�������Զ�ѡ���Ӧ���ݼ��� 1.1.2.2. Dataset parameter for flexible setup The dataset parameter in Imago connection settings is now optional, providing greater flexibility in how image data is structured in Imago. Setting the dataset name to blank removes the need to manually switch datasets for different drilling types or mine levels, as Leapfrog will automatically select the appropriate dataset based on available imagery. 1.1.2.3. �Զ���λ����Leapfrog����֧��Imago������Leapfrog��Ŀ֮����Զ���λת������ImagoӰ��������Leapfrog��Ŀ����ʹ�ò�ͬ��λ����Ӣ�����ף�ʱ��ϵͳ���Զ���ɵ�λת�����ù��ܿ�ȷ��Ӱ����������ݱ���һ�£������˹���������Leapfrog Imago���������У��轫��λ����ΪLeapfrog��Ŀ�����õĵ�λ�� 1.1.2.3. Automatic unit conversion Leapfrog now supports automatic unit conversion between Imago workspaces and Leapfrog projects. If Imago imagery and Leapfrog project data use different units, such as feet and metres, the integration will automatically convert between them. This ensures consistent alignment of imagery and drillhole data without manual adjustments. In the Leapfrog Imago connection settings, set the unit to the units of the Leapfrog project.
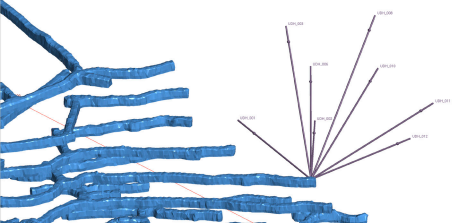
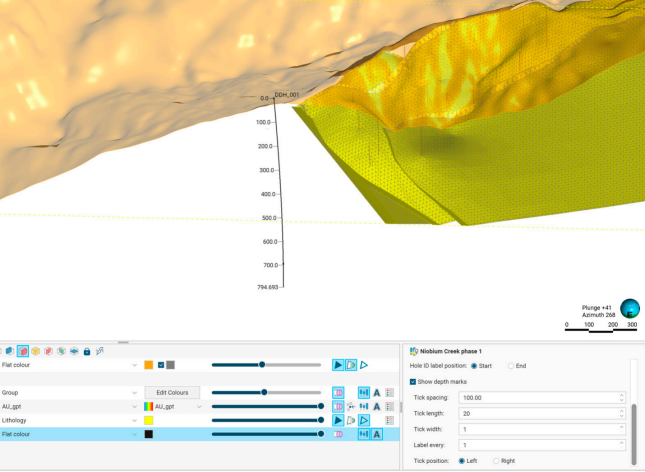
1.1.3. ��������꾮���û�����1.1.3.1. ������������ڱ�ǽ����ڵ����꾮���þ���λ�õĹ滮�꾮�У������ֿ���ʶ�ص������⣬������ά�������������ָ���ס�Leapfrog 2025.3 �汾���������꾮��ʼ�˻�ĩ�˱�ע��ʶ�Ĺ��ܡ��˴θ��²��������˲�������ԣ����Ż��˿��ӻ�Ч����ʹ�꾮ʶ�𡢽�ͼ�������꾮������ͨ����ø��ӱ�ݸ�Ч�� 1.1.3. Elevated user experience for planned drilling 1.1.3.1. End of hole labels for planned drillhole group Planned holes that share a collar location, such as underground fan drilling, often resulted in overlapping hole ID labels, making it difficult to identify individual holes in the 3D scene. In Leapfrog 2025.3, labels can now be placed at either the start or end of the hole. This update provides greater flexibility and improved visualisation, making it easier to identify holes, create clear screenshots, and communicate drilling plans.
1.1.3.2. ����������ȱ�־�꾮��ƿ���������ȱ�ǡ��û����Զ�����λ�ã�����ÿ��50�����ÿ̶��ߣ�����ע50�ס�100�ס�150�ס�200����ֵ����Щ�����ֱ��չʾ�����ȷֲ�������ͼ���꾮��Ƹ��������� 1.1.3.2. Depth markers for planned drillhole group Depth markers are now supported for planned drill holes. Users can customise the placement of depth marks, for example, displaying a tick mark every 50 metres downhole with corresponding labels such as 50, 100, 150, and 200 metres. These markers offer a clear way to visualize depth along a planned hole for better presentation of planned holes in the scene.
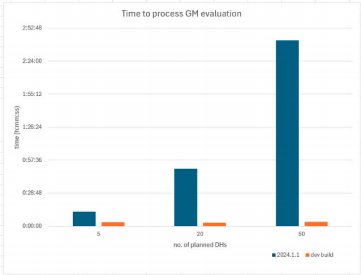
1.1.3.3. ����Ч���ھ�λ���ʱ���ϵ���ģ��ʹ����Ч������������ԭ�Ⱥ�ʱ��Сʱ���������ڽ��������Ӽ�����ɡ� 1.1.3.3. Performance improvements Significant performance improvements have been made to geological model evaluations on planned drillholes. Tasks that previously took hours to process now only take minutes.
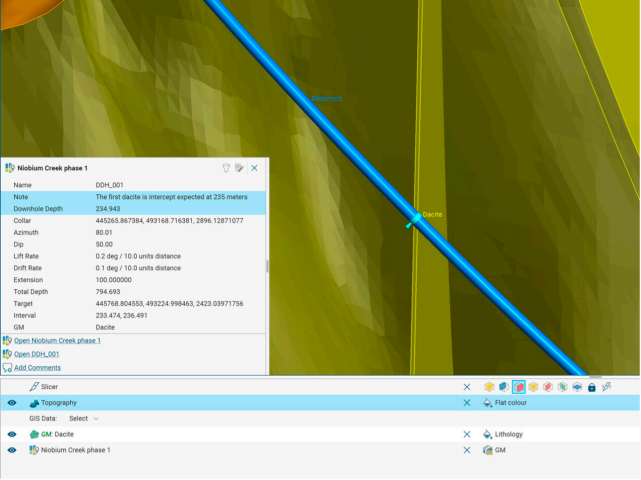
1.1.3.4. ������ͼϸ�� ���������̽�����������ͼ��������ʾ������ά������ѡ�������ף��ɲ鿴��ѡλ�õ���ȣ�����ʶ��ؼ�λ�á� �滮����������������ʾ�ڳ��������У���ֱ������ͼ�ڷ��ʹ滮��ע�� 1.1.3.4. Informative scene details Planned drilling downhole depth is now visible in scene details. Selecting a planned hole in the 3D scene reveals depth at the chosen point, aiding identification of key locations. Comments from Planned Drillhole groups are also now shown in scene details, providing access to planning notes directly in the scene.
1.1.3.5. ���������ɸѡ����
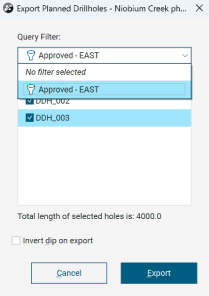
Ŀǰ�ɽ���ѯ������Ӧ���ڵ��������ײ������ù���ʹ�û��ܹ�ѡ��Ŀ����ײ�������ѡ����ף��Ӷ������̲���ʡʱ�䡣 1.1.3.5. Filter on export for planned drillhole group It is now possible to apply query filters when exporting planned drillholes as parameters. This allows users to select hole of interest and export only those, streamlining the process and saving time.
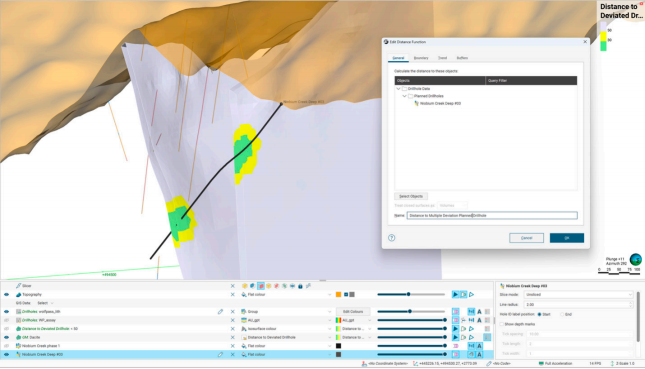
1.1.3.6. ���ж�����ľ��뺯�� ���ڿɽ������������������뺯�����Ӷ�ʵ������������ڽ��Ժ˲飬ȷ�������������������С���롣�˾ٿ�������������ˮƽ��Ϊ��滮�ṩ����ѧ���ݡ� 1.1.3.6. Distance functions with multiple deviation holes Multiple deviation holes can now be input into a distance function, allowing for drill spacing analysis and proximity checks to ensure minimum distance from other holes or mine developments. This enhances risk assessment and supports more informed drillhole planning.
1.1.3.7. �������ͼ��ȱ��
���������ͼ�У�����ѧ���ֿ��� 1.1.3.7. Drillhole correlation depth markers In the drillhole correlation view, markers can now be added at geological points of interest in 2D, which are also displayed in 3D. This makes it easier for geologists to orient themselves and correlate between 2D view location and 3D space. Multiple markers can be added for reference, supporting powerful analysis across geological features.
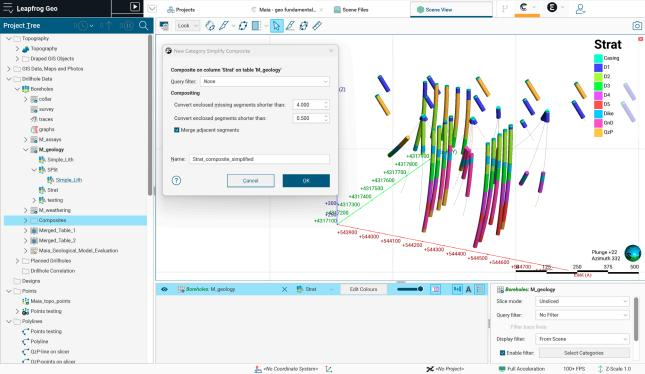
1.1.4. ������Ʒ��ϵ���ǿ1.1.4.1.������������Ʒ���Leapfrog 2025.3�汾�Ƴ���һ���ǿ���������Ʒ��Ϲ��ߣ��û��ڱ��ֵ��ʱ�����Ϣ��ͬʱ���ܸ����ؿ��Ʒ������ݵ���������̡��봫ͳ�����ݼ�Ϊ�����ԡ��ⲿ���Լ��������Ե���Ϸ�����ͬ���ù��߱���ԭʼ���Դ��룬���ṩ�������ڶκϲ�ѡ���ȱʧ���ת�����ܡ���һ�����ڷ绯����ģ���ز㽨ģ����Ҫ��ȷ������ݵĹ��������о�����Ҫ��ֵ�� 1.1.4. Essential compositing enhancements 1.1.4.1. New category simplify composite Leapfrog 2025.3 introduces a powerful new composite tool that gives users greater control over how categorical data is cleaned and simplified while preserving geological context. Unlike traditional compositing that reduces data to Primary, Exterior, and Ignored codes,this new method retains original lithology codes and offers flexible options for merging adjacent segments and converting short or missing intervals. This is especially valuable for workflows like oxidation or stratigraphy modelling, where true layer thicknesses are critical.
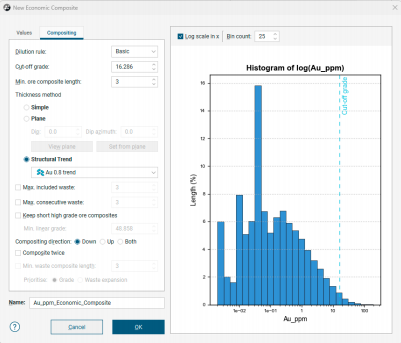
1.1.4.2.�ɰ����Ƚ�����Ʒ������������ۺϷ���ϵͳ�������������ơ� ��ȼ��㹦�ܣ��ù����Թ�������Ϊ�ο�����ͨ������������е����ʵ��ȣ��ܸ���ʵ�ط�ӳ������̬�������������������б���Ρ�������Ĺ����������ۺ����ݲ��غ�ʱ��ϵͳ���Զ�������ʾ��ȷ���������ɿء� 1.1.4.2. True thickness in economic composite Economic Composite now offers the addition of a ��Structural Trend�� Thickness method, which calculates true thickness at each interval midpoint using a Structural Trend as the reference orientation. This provides a more geologically realistic representation of deposit geometry, especially in folded or dipping terrains. Leapfrog will alert users if the trend input doesn��t overlap with the composited data, ensuring transparency and control.
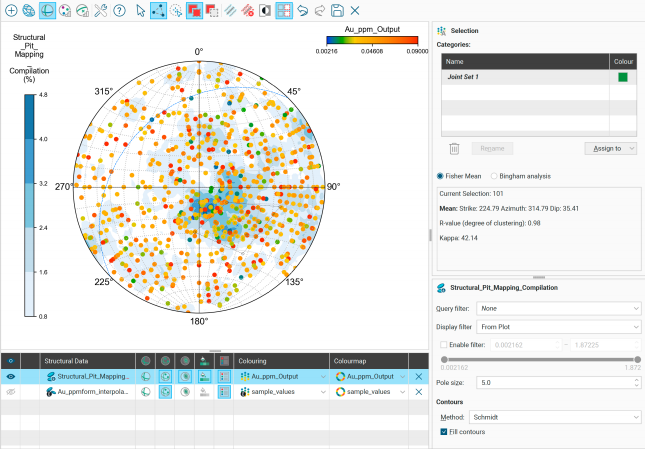
1.2. ͨ����ǿ�Ľṹ���ܻ�ø��������ʶ1.2.1. ����������沼�ּ����˹��ܵĸĽ��������ߵ����������ýṹ�����������̸�����ֱ�ۣ����������ǿ������ɸѡѡ������ı༭�����Լ��Ż��Ľ��沼�֡��û����ڿ���ͨ�������У���ز�б�ʻ�������ԣ�ѡ�������ɸѡ��ʾ���ݣ��Ӷ��ڽ������л�ø��������ʶ���༭���ѡ�����ڸ��Ӽ�㣬�û���ͬʱ�����к�ɫ��ͼ�����������������ơ������������Ѽ�����ʾɸѡ���ܣ��������ѡ������˫�˻��飬��Щ���ܲ����ӿ�������̽���ٶȣ��������������Ӿ������ȡ� ���⣬������Ƶ������������������������ԣ�Ϊ�������ѧ�Һͽ�ģ��Ա�ṩ�˸���ࡢ��Ӧ����Ľ��档 1.2. Deeper insights through enhanced structural capabilities 1.2.1. New interface layout and filtering in stereonet Latest updates to the stereonet tool make structural analysis workflows easier and more intuitive, thanks to enhanced data filtering options, more flexible editing controls, and cleaned-up interface layout. Users can now filter displayed data by choosing categories from any column, such as grade or geological attributes, which provides deeper insights during interpretation. Editing category selections is now simpler, as you can change both the column and the colourmap at the same time, removing earlier restrictions. The stereonet scene now includes integrated display filtering, like category selectors and double-ended sliders, which speeds up data exploration and sharpens visual clarity. Additionally, the redesigned properties panel and toolbar boost usability, giving structural geologists and modellers a cleaner, more responsive interface.
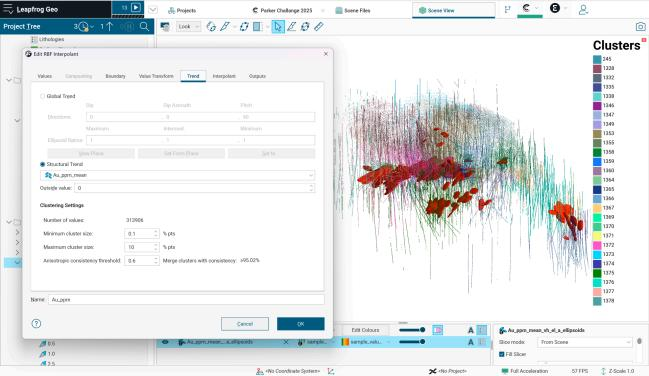
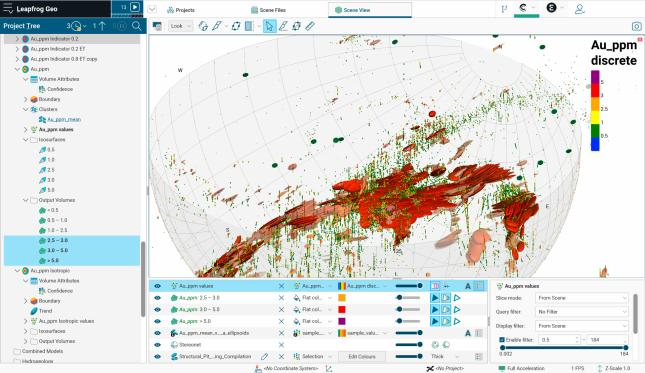
1.2.2. �ṹ����1.2.2.1. ����������Leapfrog 2025.3�汾�У��ṹ���Ƶľ��������Ѵ����ƶ�����������ģ�ͣ�������������õ���ֵģ�ͣ���������Ȩ��������ֱ�Ӹ���ģ�ͼ���Ӱ��ı��档ͨ�����������������Ʒ��룬���������ϵ��Ƚ��ı��洦�����������У��û��ܸ���������������̣����Ӹ�����Ӧ�ԵĽṹ�����л��档�������ʹ�õ�һ���ƿ�������ģ�ͣ�ʵ�ֿ�ģ�����Ӧ�á� Ϊ�Ż�ģ�����ã�ϵͳ��ͬ����ʾ�������ݵ���������������ȷ����������ʵ��ӳԭʼ����������ͬʱ������ɫ���빦�ܣ�֧�ֽ��������Է�����ɫͼ��ʽֱ�۳��֡� 1.2.2. Structural trends 1.2.2.1. Clustering settings In Leapfrog 2025.3, clustering settings in structural trend have been moved from the trend object to the input model (such as an intrusion surface or suitable numeric models), bringing control and clarity directly to the model and surfaces the trend affects. By separating clustering configurations from the trend and integrating them into an advanced surfacing workflow, users can achieve a deeper insight into clustering processes and benefit from a more adaptable structural trend. This approach enables a single trend to be appropriately applied across multiple models. To support better model setup, the number of input data points is now shown alongside clustering settings, helping ensure clustering settings reflect the underlying data. Additionally, a new colouring option enables clustering results to be visualized as category-based colourings.
1.2.2.2. �����������ԵĹ���Ϊ֧�ֽṹ���������и���������ѡ���ֿɽ���ѯ������Ӧ�����������˾ٿɶ�����������������ʵʩ�����Ŀ��ƣ��Ӷ������ṹ���͵����������Ч�ԡ�
1.2.2.3. ���������ȫ��ƽ����������ȫ������Ӧ���ڻ�Ͻṹ����ʱ����ȫ�����ƶ������Ϊ��������ʾ����Ŀ���С�˫���ö����ڽṹ���ƶԻ����д�ȫ�־�ֵ����ѡ������ڲ鿴ȫ�����ƶ�ģ�͵�Ӱ�졣
1.2.2.2. Filtering on mesh attributes To support more flexible data selection in structural trend generation, query filters can now be applied to attributed meshes. This allows for more targeted control over the data used in trend generation, improving the relevance and validity of structural interpretations.
1.2.2.3. Blended trends with global mean trend When a global trend is applied to a blended structural trend, the global trend object now appears as an input in the project tree.Double-clicking this object opens the global mean trend tab within the structural trend dialog, making it easier to access and understand how the global trend is influencing the model.
1.3. ��������ͼ���������и�������չʾЧ��1.3.1. ������������Leapfrog 2025.3�汾��Գ����湦�ܽ����˶����Ż���������ȥ��Ҫ�˹��������볤����������ߣ�������ʱ���������׳����������û�ֻ���Ҽ������ƽ����ͼ���ļ��У�ѡ���½���������ͼ��������һ�������ⳤ�������������ߡ�����Ľ�������˱�������ƽ����ͼ�����δ�������ʡʱ��ʡ�������������ظ��������鷳��
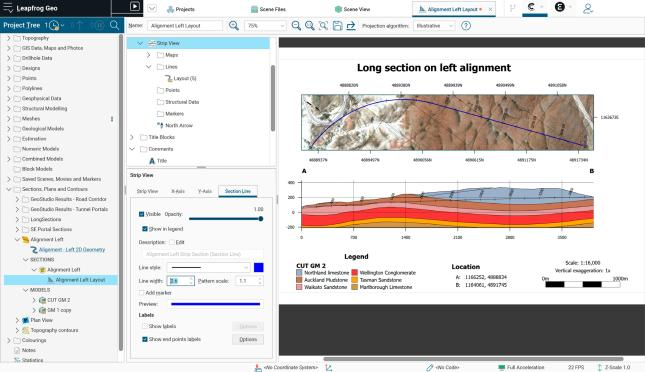
1.3. Better site presentation in sections with strip views 1.3.1. New strip view for long sections Leapfrog 2025.3 introduces several improvements focused on long sections. Accurately aligning strip views on long sections was a task that previously relied on labour-intensive manual processes and was susceptible to inconsistencies. With Leapfrog 2025.3, users can now quickly add a strip view to any long section by right-clicking on the ��Plan View�� folder and selecting ��New Strip View.�� This enhancement removes the need to use a plan view as a workaround, time, effort and double handling work.
1.3.2. ���������ߵķֶ��߿ؼ���������ͼ�ж��ʷ�����۵Ŀ��Ƽ�Ϊ���ޣ�������ͨ����ɫ�ʹ�ϸ���и��Ի���������Leapfrog 2025.3 �汾�У���������ͼ��������Ϊ���ʷ��ߡ���ѡ����ṩ��ȫ����������ѡ����⣬�˵��ǩ����A��A�䣩��λ�ÿ�ֱ������������ͼ�н��е����� ��Щ���¹�ͬ����˳�������ͳ���������������ͼ�������߿��ӻ���Ч����һ���ԡ� 1.3.3. ������������ͼ��С�����־����С������ʾѡ��������������ʾ���š����ܣ�������������ͼ��Ϊ�ṹ����ֵ���ӡ�+���C�����š���һ���������û���ȷ���������ֵ�ڽ���λ���뷽���ϵĿռ�ֲ���ϵ��
1.3.4.�źͳ�������ʹ�ð�������Ϣ�Ķ��뷽ʽ���峤����·��ʱ��Ĭ�϶β����Ѵ���������·������Ϊ����·�Ρ� ����һ�����ܸ�ֱ�۵������û����ö����ϵ�����Ϣ����ʹ�����洴�����̾۽���Ŀ������ �������X/Y����ʾѡ��������һ����ʾѡ���ʹ�ð�������Ϣ�Ķ��뷽ʽ��������·��ʱ��ϵͳĬ�ϻ����ò�����һ��Ϊ��ͶӰ���롱����ѡ���ѡ����ڳ����ϵ����ž��롣
1.3.2. New section line controls for strip view Controls for section line appearance in the strip view were minimal, allowing only adjustments to colour and thickness for customisation. In Leapfrog 2025.3, a new tab called ��Section Line�� has been added to the strip view and provides a comprehensive set of appearance options. Additionally, the location of endpoint labels (e.g. A to A��) can be adjusted directly in the strip. Together, these updates improve the efficiency and consistency for visualizing section lines in strip views in both regular and long sections.
1.3.3. Minimum distance sign for strip view A new ��Show sign�� option under the minimum distance display options now adds ��+�� or ���C�� signs to structural measurements on the strip view. This small addition help users better interpret spatial distribution of measurements in relation to section position and orientation.
1.3.4. Chainage and long sections When alignments that contain chainage information are used to define the long section path, the section parameters default is now set to ��line section�� rather than ��entire line��. This better prompts the user to make use of the chainage information on the object and to focus the long section creation to the area of interest more intuitively. A new display option has been added to the section��s X and Y axes display options. Again, when alignments that contain chainage information are used to define the section path, a new ��projected distance�� option has been added and set by default to be checked on. This option adds the chainage distance to the long section axis.
2. Leapfrog Edge����������2.1. Ӧ�Ե���ͳ��ѧ�����е���ս����������ͼ����ͳ�Ʊ��湦�ܣ��û����ڿ��Ա�������ס���λ������ģ�����ɵ�ͼ����ȷ���ؼ�����ͳ�Ʒ��������������Ŀ�С���һ�Ľ��Ż������ݶ������̣��ٽ���ѧ���߲��ƽ�ģ����֤��ʹ����ѧ���ܹ������ݼ����ֵ�����ͳ����Ա�ͳ�Ƶ�һ�¼�¼��ͨ�����������ֱ�ӹ�����ͳ����Ŀ��LeapfrogΪ����ͳ�ƽ��ͺ���Դ�����ṩ�˸�����ơ����ظ��Ҹ��ɿ��Ĺ������̡�
2. Leapfrog Edge features and functionality 2.1. Addressing challenges in geostatistical analysis With new capabilities to saved graphs and statistics users can now save graphs generated from drillholes, points, and block models, ensuring that key geostatistical analyses are preserved within the project. This enhancement streamlines data insights, promotes informed decisions and advances model validation, allowing geologists to maintain a consistent record of univariate and comparative statistics across datasets. By keeping analytical outputs directly tied to the statistical item, Leapfrog delivers a more auditable, repeatable, and confidence-building workflow for geostatistical interpretation and resource evaluation.
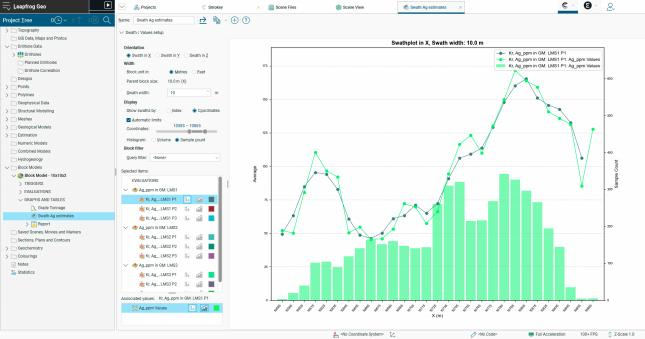
2.2. Swathͼ���Ľ���Leapfrog 2025.3�汾�У�Swathͼ��������������Դ����ѧ������֤����ģ����ʱ����˸�ǿ�Ŀ��������ù����ǶԱ�Ԥ��Ʒλ��ʵ�����ݵĹؼ����ߣ��ܰ����û���������˽������������Ч��֤����ģ�͡� �û����ڿ��ԣ� • �鿴�����ݵ������ • �����������ͨ�����й��˿� • �鿴�������ڵ����������Ը��õ����������ܶȣ� • �趨���������Ծ۽��ض����Ӷ�ʵ�ָ�ϸ�µķ������������֤�� ��Щ�Ľ�ʹSwathͼ����Ϊ�����������ܺ�ȷ����Դ����������Ŷȵĸ���Ч����ǿ��Ĺ��ߡ� 2.2. Swath plot improvements In Leapfrog 2025.3, the swath plot has been upgraded to give resource geologists greater control when validating block model estimates. The swath plot is essential for comparing estimated grades against actual data, helping users gain deeper insight into their deposit and validate block models. Users can now: • see coordinates for each data point, • filter blocks by domain, category, or estimation pass, • view sample counts within each swath to better understand data density, and • set coordinate limits to focus on specific areas, allowing for more detailed analysis and targeted validation. These enhancements make the swath plot a more efficient, powerful tool for assessing estimation performance and ensuring confidence in resulting resource evaluations.
3. Sequent Evo����������
3.1. EVO���ݹ���Leapfrog-Evo���ɵĶ���Ľ�������Ч�ʡ�Э�������Ժ����ȣ�ʹ�Ŷ��ܹ������ŵ���չ�������ݡ� 3.1.1. ����stage��stage��״̬����ͨ�����ӻ���ʾչʾ����״̬�����������С�����ɺ�ͬ������ȡ��ù������������ѧ���ڶ���㼶��ע�����Σ��Ӷ��������ŶӺ���֯�����ȡ��������ԡ�Э��Ч�ʼ���Ŀ����Ч�ܡ�Evoϵͳ�����õĽ���Ϣ��ͬ����ƽ̨���ɵĿͻ���Ӧ�ã�ȷ����Ŀȫ�������ڼ��������нδ�����һ���ԺͰ�ȫ�ԡ�
3. Seequent Evo features and functionality 3.1. Evo data management Several enhancements to the Leapfrog-Evo integration have improved efficiency, ease of collaboration, and transparency, helping teams scale and manage data with greater confidence.
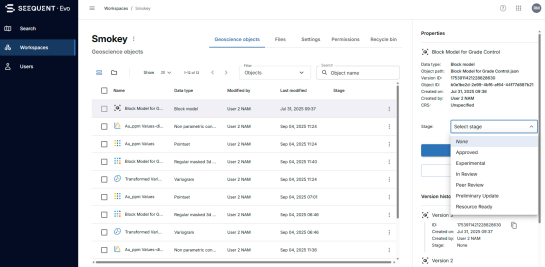
3.1.1. Data stage A ��Stage�� status provides visual cues for data status, such as work in progress, completed, and peer review. This feature allows geoscientists to mark the stages of their work at the object level, improving transparency, searchability, collaboration, and project management efficiency across teams and organisations. Stages are set in Evo and mirrored across the platform in integrated client applications, ensuring consistent and safe handling of stages throughout the workflow and lifecycle of the project.
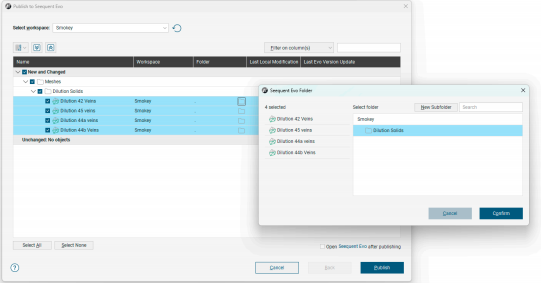
3.1.2. ���ļ�����֯����Leapfrog��Evoƽ̨���������ļ�����֯���ܣ������û���Ч���������ʽṹ����ǽṹ�����ݡ� Leapfrog 2025.3�����˴����������������ļ��м����ļ��еĹ��ܡ���ǰ����Ӧ���ļ��нṹ��δ��Evo����������ʾ�����ù������ú�����Evo������������Leapfrog�ж�����ļ��в㼶�ṹ�� 3.1.2. Data organisation with folders Folder organisation is being phased into Leapfrog and Evo to help users efficiently manage and access both structured and unstructured data. Leapfrog 2025.3 introduces functionality for creating and publishing data to folders and subfolders. Currently, the corresponding folder structure does not appear in the Evo workspace. However, once this feature is activated, your Evo workspace will display the folder hierarchy as established in Leapfrog.
3.1.3. ��Seequent Evo����������������Leapfrog������������Seequent Evo���¼����������ݡ����ܣ� ּ�ڼ������̡������˹���Ԥ���ù��ܿ��������¶������ ��������ֶ����أ��ر���������Ҫʵʱ��ȡEvo�������ݵĴ�����Ŀ�� 3.1.3. Bulk reload latest from Seequent Evo A new bulk ��Reload Latest from Seequent Evo�� action in Leapfrog was designed to streamline work and reduce manual effort. Instead of manually reloading each Leapfrog object one by one, multiple objects can now be updated simultaneously. This is particularly useful for keeping large projects up to date with the latest data from Evo.
3.2.�������������ݽ�����ǿ�����������������ݵķ������߰��ѵõ���չ��ʹ����ѧ���ܹ���������˽��ģʽ�����������������ԵĹ�ϵ�� ���ڿ���ֱ�Ӷ����������ݽ��м��㣬������������ֵ�������㣬��ͨ�������ļ���˵�����ʡ���ʹ���������������ṹ���ݶ���һ�£���Ϊ�Զ�������������µĿ����ԡ� ���⣬�����ṩ���������ݵ�ͳ�ƹ��ߣ���Щ���ݴ�Driver���룬�书����ṹ�����еĹ�����ƥ�䡣��ʹ���û��ܹ�̽��������������б�ʵ�����֮��Ĺ�ϵ����������ǰ��ʵ�ֵġ� Ϊ��һ�����������ԣ��Ѷ����нṹ���������������ǡ�����������λ�Ǽ�ǿ��������ͳһ����ɫ���ơ� ��ע�⣬��Щ������ͬʱ����Seequent Evo��Driver���������Ļ�����ʹ�á� 3.2. Powerful new tools for interpreting Driver��s ellipsoid data The analytical toolkit for ellipsoid data has been expanded to give geologists deeper insight into structural patterns and their relationships with other geological attributes. Calculations can now be performed directly on ellipsoid data, including variable, numeric, and category calculations, accessible via a new calculations menu item. This brings ellipsoids in line with other structural data objects and opens new possibilities for custom analysis. In addition, statistics tools are now available for ellipsoid data imported from Driver, matching the functionality already available for structural disks. This enables users to explore relationships between ellipsoid orientation and attributes like grade, which was not possible before. To further enhance interpretation, consistent colouring limits for dip, pitch, azimuth, and strength across all structural and ellipsoid objects have been introduced. Please note, these features require access to both Seequent Evo and Driver to be available in your environment.
3.3. ���Թ�����Leapfrog 2025.3�汾�У������ѧ���ǻ����һ��ǿ���¹��ܣ�ͨ��Seequent Evoƽ̨���ñ���ģʽ����ʵ�ֵ���ģ������ֵģ������������ԵĹ�������һ�����Ż���Leapfrog��Evo֮���ģ�����ݵ��뵼�����̣�ʹ���Ŷ�Э�������������ݽ������Э��ͳһ��ͨ����Evoƽ̨�����͵�������б���ģ�����ԣ��û������ܹ�������ø��������ߡ����ӻ����ܺ;���֧��ϵͳ��ͬʱ��������Leapfrogģ�͵���������Ϣ�����ԡ����־�ŵ����ѧ��̬ϵͳ������ں���������Ҫһ�������ݵ�������������������ֵ�õ���ַŴ�
3.3. Seamless attribute sharing In Leapfrog 2025.3, geoscientists gain a powerful new capability: the ability to share attributes on geological and numeric model volumes using a standardized schema in Seequent Evo. This enhancement streamlines the import and export of model data between Leapfrog and Evo, enabling richer collaboration and more consistent data interpretation across teams and workflows. By preserving attributes during publish and import from Evo, users can now leverage advanced analytics, visualization, and decision-making tools without losing the context or complexity of their Leapfrog models. This marks a significant step toward a more integrated geoscience ecosystem, where data flows freely and insights are amplified.
3.4. EVO�����������֧�����ڣ���Ƶ���������Ϊ�꾮���Evo�����͵��롣��һ�Ľ��ٽ��������ƵĹ��������ڲ�ͬLeapfrog�û�֮���Э��������δ����Evo�������ʵ��Э����
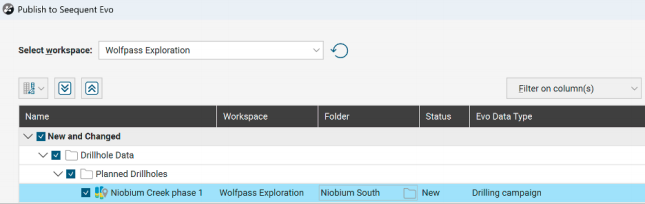
3.4. Evo support for planned drillhole groups Planned drillhole groups can now be published and imported from Evo as drilling campaigns. This enhancement facilitates the sharing of drillhole plans, enabling easy collaboration between different Leapfrog users and, in the future, with Evo partners.
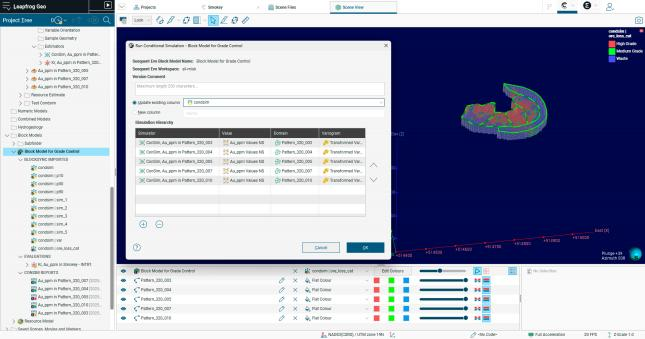
3.5. ����ģ�����Ѽ�����߿�����Leapfrog 2025.3�汾��Leapfrog Edge������ģ��ܽ������ش���������ǰ��ģ�����н����ڱ��ش洢��Blockģ�͡��Ըð汾������ģ�����ʹ��BlockSyncͬ��ģ�͡�Ҫִ��ģ�⣬���Ƚ�Blockģ�ͷ�����BlockSyncƽ̨���ⲻ��֧�ֶ��û�Э��������ʵ�ֶ�վ�㼶ģ���Ӽ���Эͬ������ͨ����¼��Blockģ��ϵͳ���а汾���ƣ���֧�����ģ���ʵ�ù������̡� �¹������̸�ֱ���ҿ���չ�������û������ܵع���������Ч��Э�������ڿ�ģ�͵���֤�DZ�������̵�ϵͳ���ϣ��ܿ��ٸ��������������ƽ��ֵ�����ǽ�����û��ȿɽ�ģ�����ϲ�Ϊ��һ�У�Ҳ�ɱ��ֶ����У��Ӷ����ܸ��졢����Ч�����д��������������� ��һ�Ľ������������ԣ���Ϊ�����Ľ�ģ�춨�˻�������Ҳ��ζ�ţ� • �ֲ���ģ�Ͳ�������������ģ�⡣ • ����2025. 1��2025.2�汾���������ؿ�ģ���е���������ģ��������ʧ�����豣����Щ�������������ǰ����ģ�ͷ�����BlockSyncƽ̨�� �¹������̸���ֱ�ۣ���֧�ֿ���չ�����ݹ����������û������ܵع���������Ч��Э���� 3.5. Conditional simulation now streamlined for improved usability Leapfrog 2025.3 introduces a major change to how conditional simulation works in Leapfrog Edge. Previously, simulations could run on local block models stored in your Leapfrog project. From this release onward, conditional simulation requires a BlockSync block model. To run a simulation, the block model needs to be published to BlockSync first, enabling multi-user collaboration, working on subsets of blocks from a site-wide model, version control from the block model system of record, and practical workflows like combined simulations. The new workflow is more intuitive and scalable, helping users work smarter and collaborate more effectively. A validation dashboard under the block model, combined with a traffic-light system, quickly flags results based on the difference between the mean of composites and realizations. Users can also combine simulations into a single column or keep them separate, and enjoy performance improvements for faster, more efficient runs. This change improves usability and sets the foundation for more advanced modelling, but it also means: • Local block models can no longer be used for conditional simulation. • If you upgrade from 2025.1 or 2025.2, any existing conditional simulation results on local block models will be lost. To keep them, publish your block model to BlockSync before upgrading. The new workflow is more intuitive and supports scalable data management, helping users work smarter and collaborate more effectively.
|